


Adtech Firm Ivee Partners With Taxi Tech Firm CMT For New Approach To DOOH Screens In Back Seats Of Rideshares And Taxis
April 26, 2024 by Dave Haynes
Another adtech/media company is taking a run at turning the back seats of hired ride vehicles into a media environment with the Chicago-based “software …
Read moreBrightSign Offers Sustainability-Focused Trade-In Incentive Program For EOL’d Players
April 26, 2024 by Dave Haynes
This may be common, for all I know, with tech hardware – but it’s new to me: an AV hardware manufacturer running a trade-in …
Read more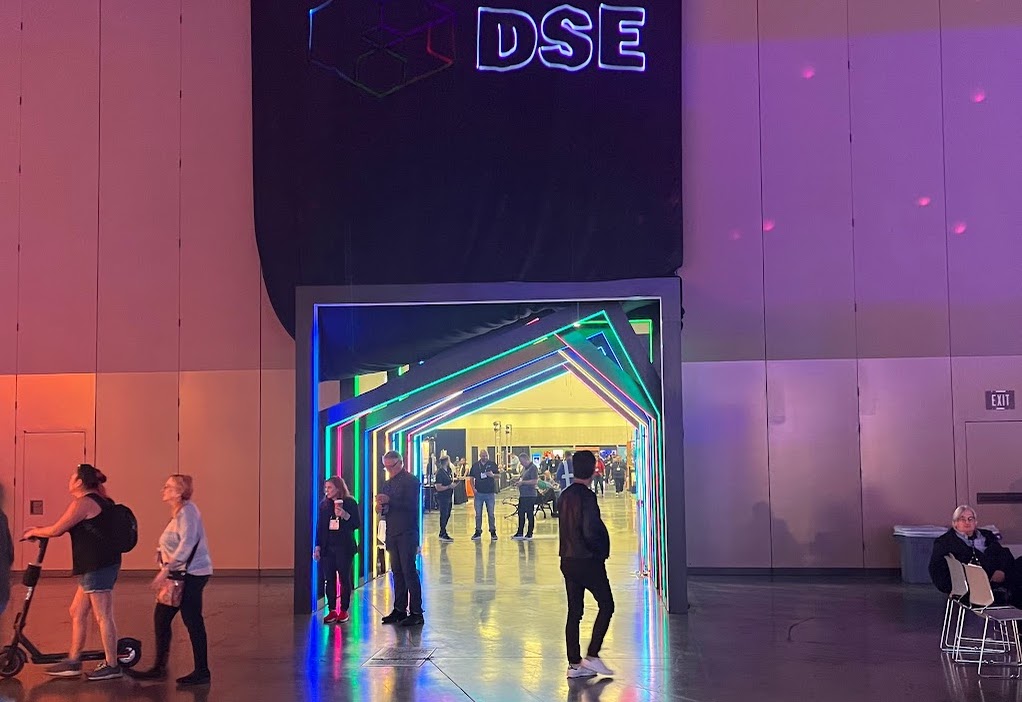
DSE Releases Initial Speaker Line-up For December 2024 Event In Las Vegas
April 26, 2024 by Dave Haynes
Questex, the industry events company behind Digital Signage Experience (DSE), has started marketing the 2024 versions set for early December in Las Vegas, announcing …
Read more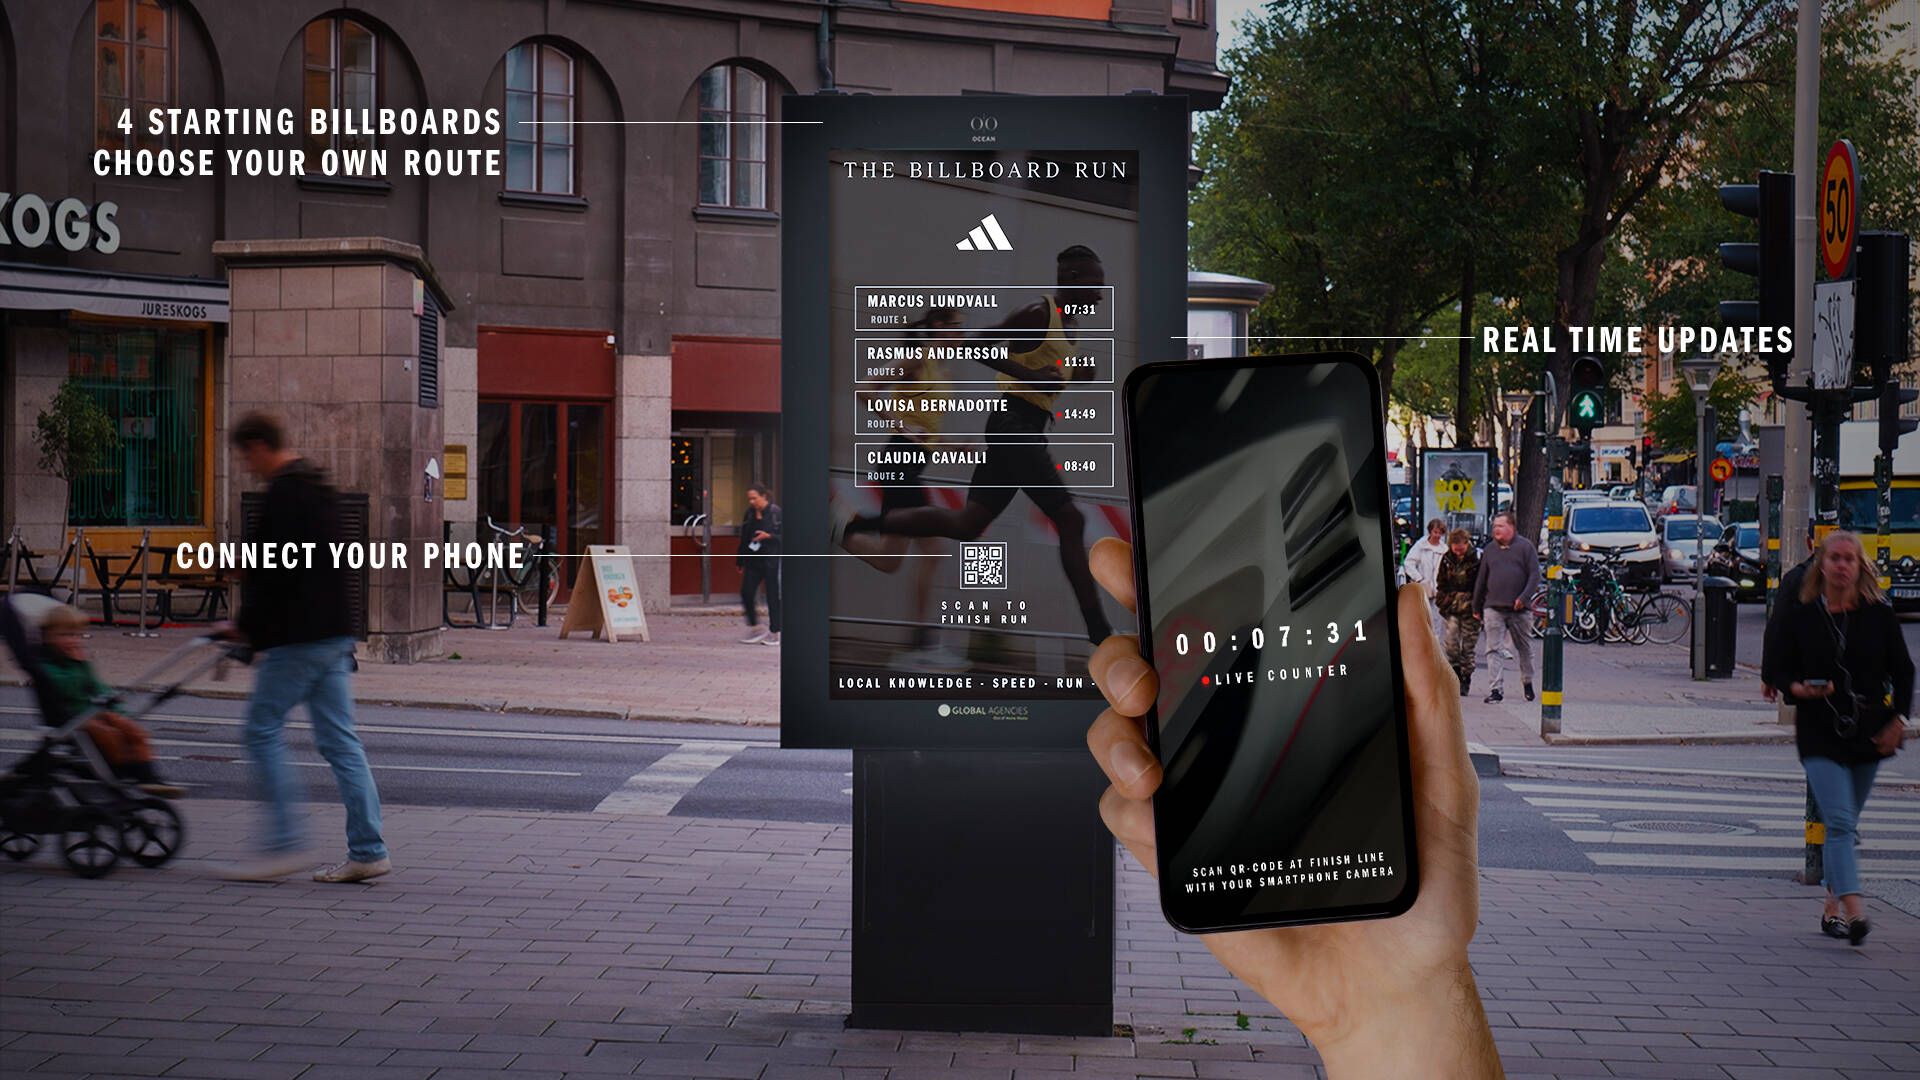
Clever Adidas Campaign Turns Stockholm DOOH Totems Into Competitive Running Checkpoints
April 26, 2024 by Dave Haynes
This is a clever campaign done to market Adidas in Stockholm, Sweden – a digital OOH campaign tied to an app that lets runners …
Read more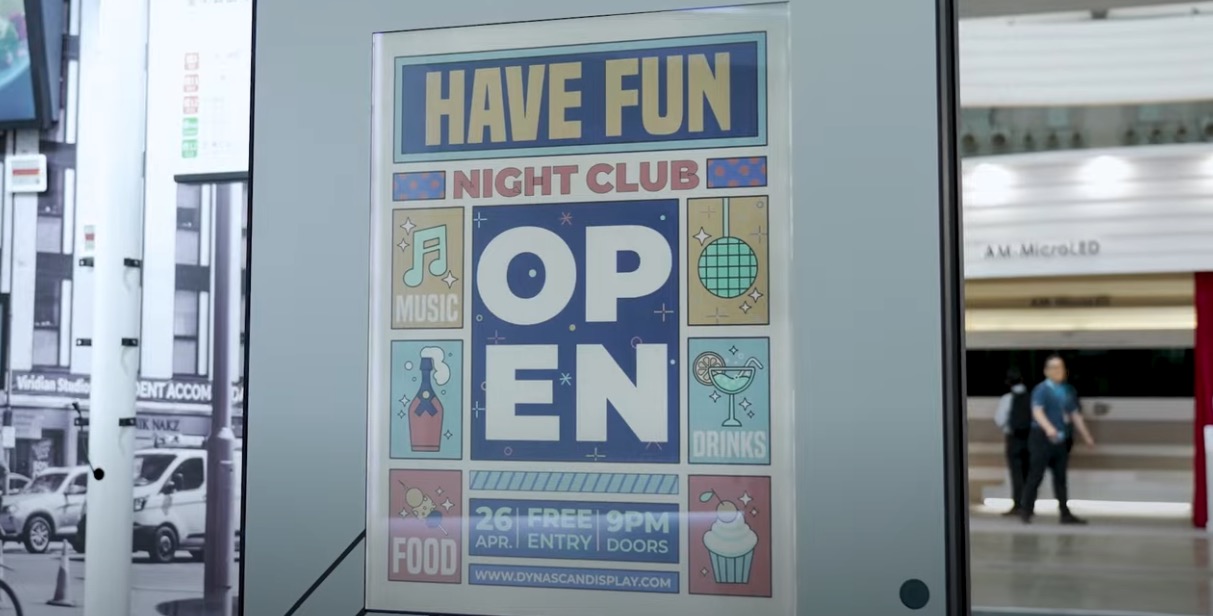
Video: E Ink Shows Its Full Range Of Color E-Paper Displays
April 25, 2024 by Dave Haynes
Presumably timing this to Touch Taiwan this week and a big exhibit stand at that show, E Ink has put out a promo video …
Read more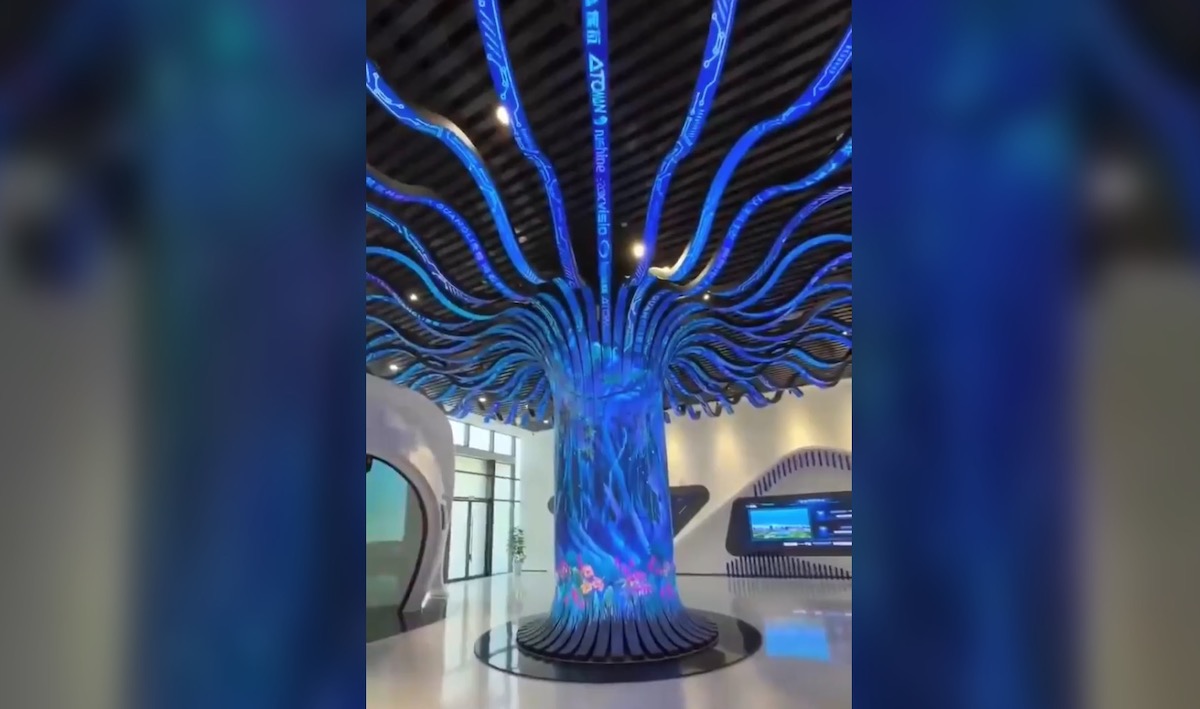
Flexible LEDs Create Giant Digital “Wisdom Tree”
April 25, 2024 by Dave Haynes
The Shenzhen LED manufacturer Ocolour seems to specialize in somewhat unconventional products – both in shape and where they go. I see lots of …
Read more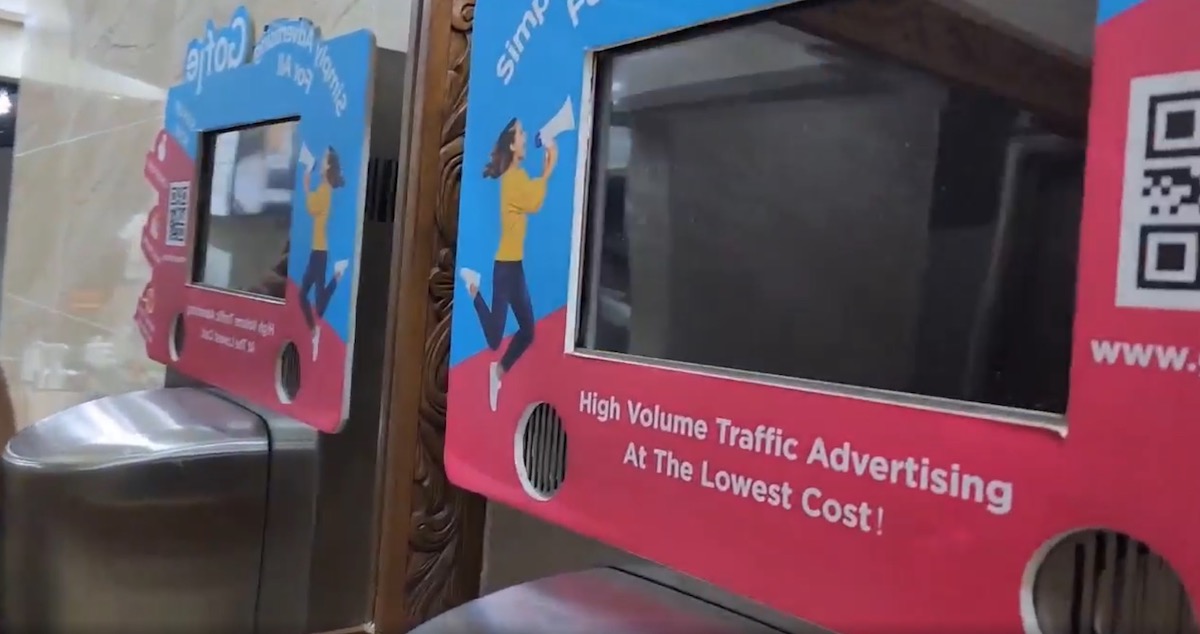
Is This The Worst DOOH Deployment … Ever?
April 25, 2024 by Dave Haynes
Oh dear … The idea of putting ad screens in the washrooms of bars and restaurants – including embedded in urinals, no really – …
Read more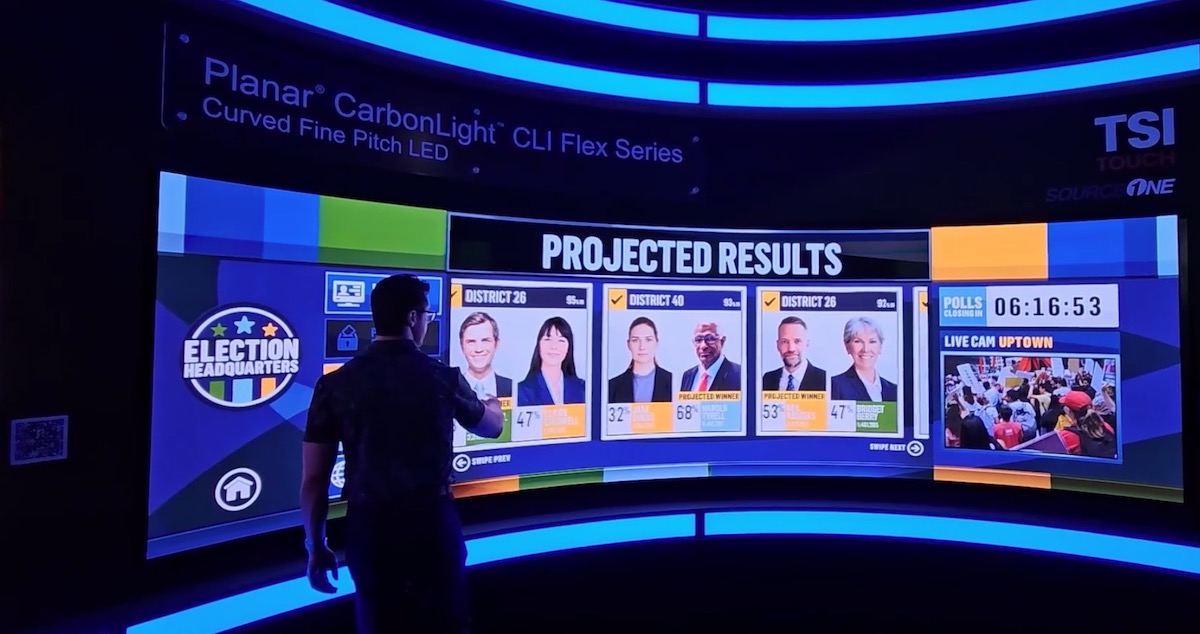
Did You Know A Curved LED Wall Could Support Touch? Me Neither …
April 25, 2024 by Dave Haynes
When finer pitch LED video wall tech started coming on the market, one of the knocks other than the big one – high cost …
Read more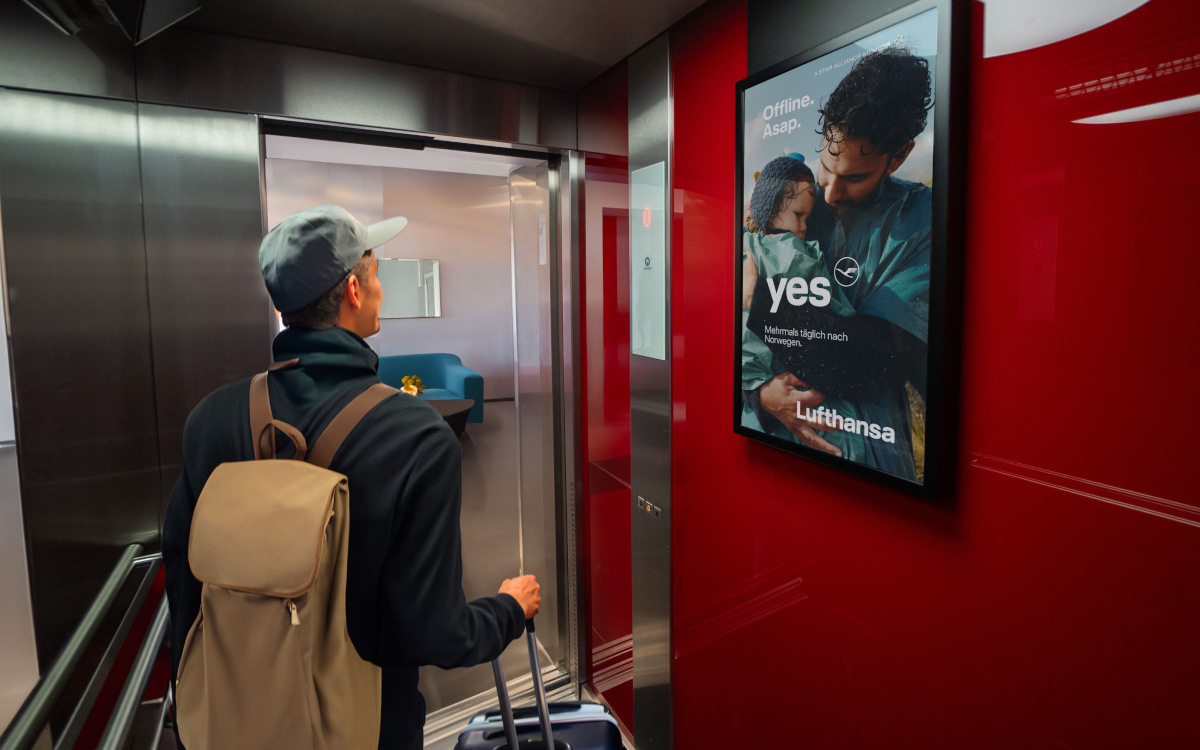
Elevator Giant Schindler Expands Its Own DOOH Media Network Via EU Partners
April 25, 2024 by Dave Haynes
I found my way into the very nascent digital signage and DOOH sectors 25 years ago, puzzling the hell out of my daily newspaper …
Read more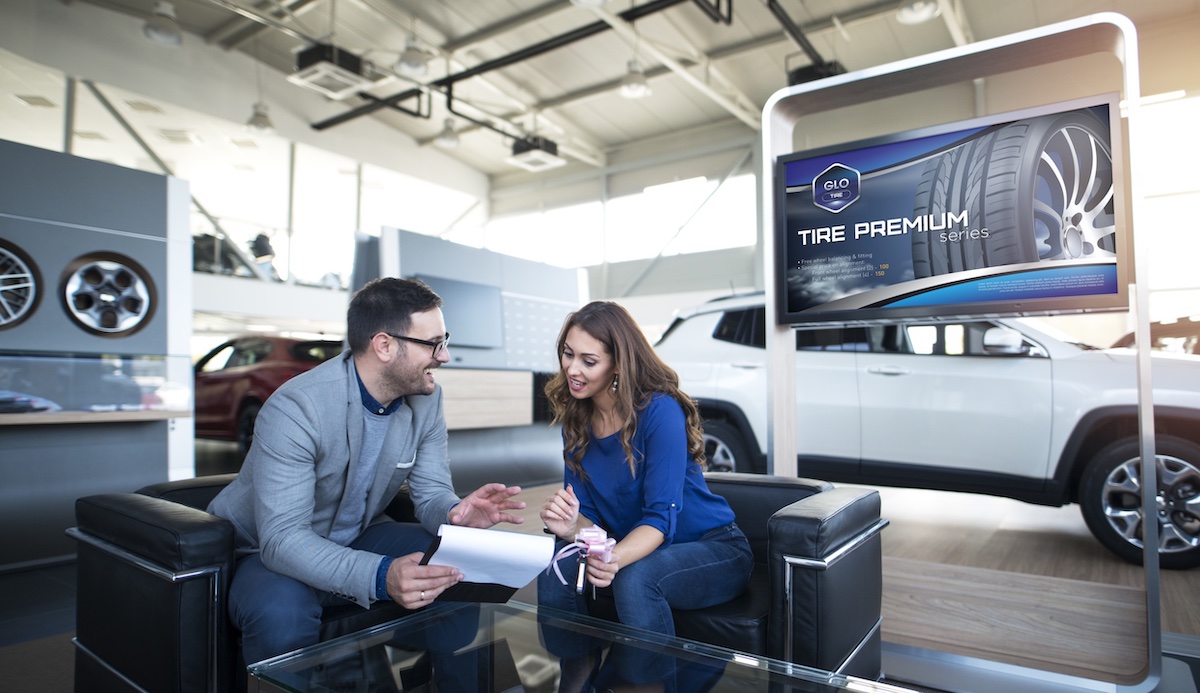
AI And The Other Technologies Helping Shape Experience In Auto Retailing
April 25, 2024 by Robert Orndorff
Guest Post: Robert Orndorff, Spectrio Customer experience, both pre and post sale, has always been at the heart of successful auto dealer operations, and …
Read more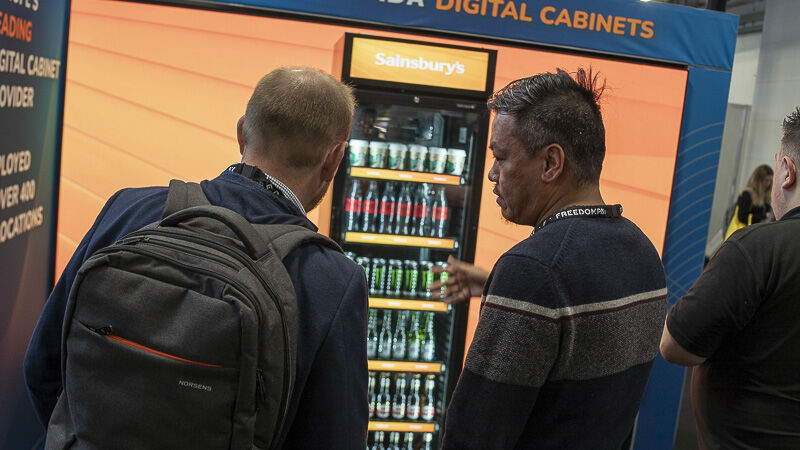
UK Firm Demos More Sensible Approach To Screens In Retail Chiller Fridges
April 24, 2024 by Dave Haynes
A UK retail hardware solutions firm called Theravada is at the Retail Technology Show in London this week, among many vendors, and is showing …
Read more
How Sphere Has Triggered Global Interest In Making Big Structures Media Facades, With SACO Technologies CEO Jonathan Labbee
April 24, 2024 by Dave Haynes
When I first spoke with Jonathan Labbee about the grand-scale media facades and displays being produced by SACO Technologies, the Sphere in Las Vegas …
Read more